Integrated metabolomics and proteomics from voxelated cortical hemispheres of adult rhesus monkeys
Abstract
The spatial organization of molecular networks across cortex likely contributes to differences in local circuit vulnerability in aging and Alzheimer's disease; yet many existing molecular datasets sacrifice spatial structure, sampling only a handful of regions per brain. Here, we present a framework for generating spatially registered, paired metabolomic and proteomic maps across an entire cortical hemisphere of an adult rhesus monkey, at millimeter resolution. One hemisphere each from two animals was harvested under controlled conditions, approximately flattened, and hand dissected at different sampling resolutions (roughly 2.5 and 4 mm/side) into tissue voxels. Each voxel was split after homogenization and extraction to provide matched aliquots for targeted metabolomics and deep untargeted proteomics. To handle these high dimensional data, we developed PChclust, a principal component guided feature clustering algorithm. For cross omic integration, we developed a spatially regularized sparse canonical correlation analysis (sr-sCCA), which incorporates spatial neighborhood structure via graph Laplacian smoothing. We recover meaningful biology: Molecular similarity between neighboring voxels decayed with distance in both modalities, confirming that voxelation captures spatially organized biological variance. The sr-sCCA identified joint proteome-metabolome components with coherent cortical gradients that were conserved across animals. Pathway enrichment analysis recovered brain relevant ontologies and reconstructed complete metabolic circuits from single voxels.
Integrated metabolomics and proteomics from voxelated cortical hemispheres of adult rhesus monkeys
Authors
Qiuyi Wu¹,², Alev M. Brigande¹, Michael W. Lutz³, Pixu Shi², and Anita A. Disney¹
¹ Department of Neurobiology, Duke University, Durham, NC, 27710 ² Department of Biostatistics and Bioinformatics, Duke University, Durham, NC, 27710 ³ Department of Neurology, Duke University, Durham, NC, 27710
Corresponding author email address: anita.disney@duke.edu
Abstract
The spatial organization of molecular networks across cortex likely contributes to differences in local circuit vulnerability in aging and Alzheimer’s disease; yet many existing molecular datasets sacrifice spatial structure, sampling only a handful of regions per brain. Here, we present a framework for generating spatially registered, paired metabolomic and proteomic maps across an entire cortical hemisphere of an adult rhesus monkey, at millimeter resolution. One hemisphere each from two animals was harvested under controlled conditions, approximately flattened, and hand dissected at different sampling resolutions (roughly 2.5 and 4 mm/side) into tissue voxels. Each voxel was split after homogenization and extraction to provide matched aliquots for targeted metabolomics and deep untargeted proteomics. To handle these high dimensional data, we developed PChclust, a principal component guided feature clustering algorithm. For cross omic integration, we developed a spatially regularized sparse canonical correlation analysis (sr-sCCA), which incorporates spatial neighborhood structure via graph Laplacian smoothing. We recover meaningful biology: Molecular similarity between neighboring voxels decayed with distance in both modalities, confirming that voxelation captures spatially organized biological variance. The sr-sCCA identified joint proteome-metabolome components with coherent cortical gradients that were conserved across animals. Pathway enrichment analysis recovered brain relevant ontologies and reconstructed complete metabolic circuits from single voxels.
Introduction
A central difficulty in understanding the most common, late-onset, form of Alzheimer’s disease (LOAD) is not a lack of molecular hypotheses; it is that many hypotheses are underdetermined by the measurements we typically make. Many of the challenges in understanding and clinically addressing LOAD arise from three facts: pathology begins ~20 years before diagnosis; pathology and function are not tightly coupled; and the paths to pathology are many. These observations imply that comparisons between diagnosed individuals and matched controls can be both reproducible and mechanistically ambiguous: they pool individuals who may share a diagnostic label but not a causal route, and they often sample tissue after much of the relevant biology has already unfolded.
One response to these challenges is to change the unit of inference. A spatially resolved molecular case study within one individual has one key advantage: at a fixed time point, risk factors and insults are held constant, and regional differences can be interpreted against that shared background. Spatially resolved studies at the scale of the whole cortex, in particular, are likely to be important because many LOAD-associated pathologies follow predictable spatiotemporal patterns. If these spatial patterns reveal regional differences in vulnerability or resilience, then measurements that erase spatial structure discard relevant information.
Despite this potential, most molecular datasets in Alzheimer’s disease neuroscience are spatially coarse. We typically sample a handful of regions, homogenize each, and search for associations with clinical or pathological labels. This strategy cannot represent gradients, boundaries, or patchy structure across the cortical sheet, and makes it difficult to distinguish true biological differences from differences in cellular composition, vascular content, or local microenvironment.
Here, we present a framework that enables spatially resolved molecular comparisons across the cortex, using paired metabolomics and proteomics. Our underlying motivation is to work toward understanding the LOAD prodrome, but the framework is general: it produces spatially registered molecular maps that can be aligned to pathology, cytoarchitecture, and connectivity.
Why the cortex of rhesus monkeys? Many LOAD-relevant vulnerability patterns are properties of cortex, which is a structured sheet embedded with primate-specific association networks. Sufficiently detailed spatial mapping is difficult to obtain from humans — particularly in the prodromal phase — because the relevant individuals are hard to identify pre-mortem, documentation of environmental factors is limited, and preservation of biomolecules is challenging under typical harvest conditions. In rhesus monkeys, tissue collection can be controlled in ways that reduce these confounds.
Why paired metabolomics and proteomics? The biological questions motivating LOAD research — energetics, oxidative stress, lipid remodeling, neurotransmitter metabolism, proteostasis — are pathway questions. The proteome reflects catalytic and structural capacity; the metabolome reflects biochemical activity at the time of measurement; either layer alone is easy to over-interpret. Paired measurements constrain interpretation by asking whether a pathway-level narrative has support on both sides of the enzyme–substrate divide.
Methods (Summary)
Animals: Two adult female rhesus monkeys (Macaca mulatta; A27, 22 years; A26, 24 years) from the Oregon National Primate Research Center were used. Both were pre/peri-menopause at tissue harvest.
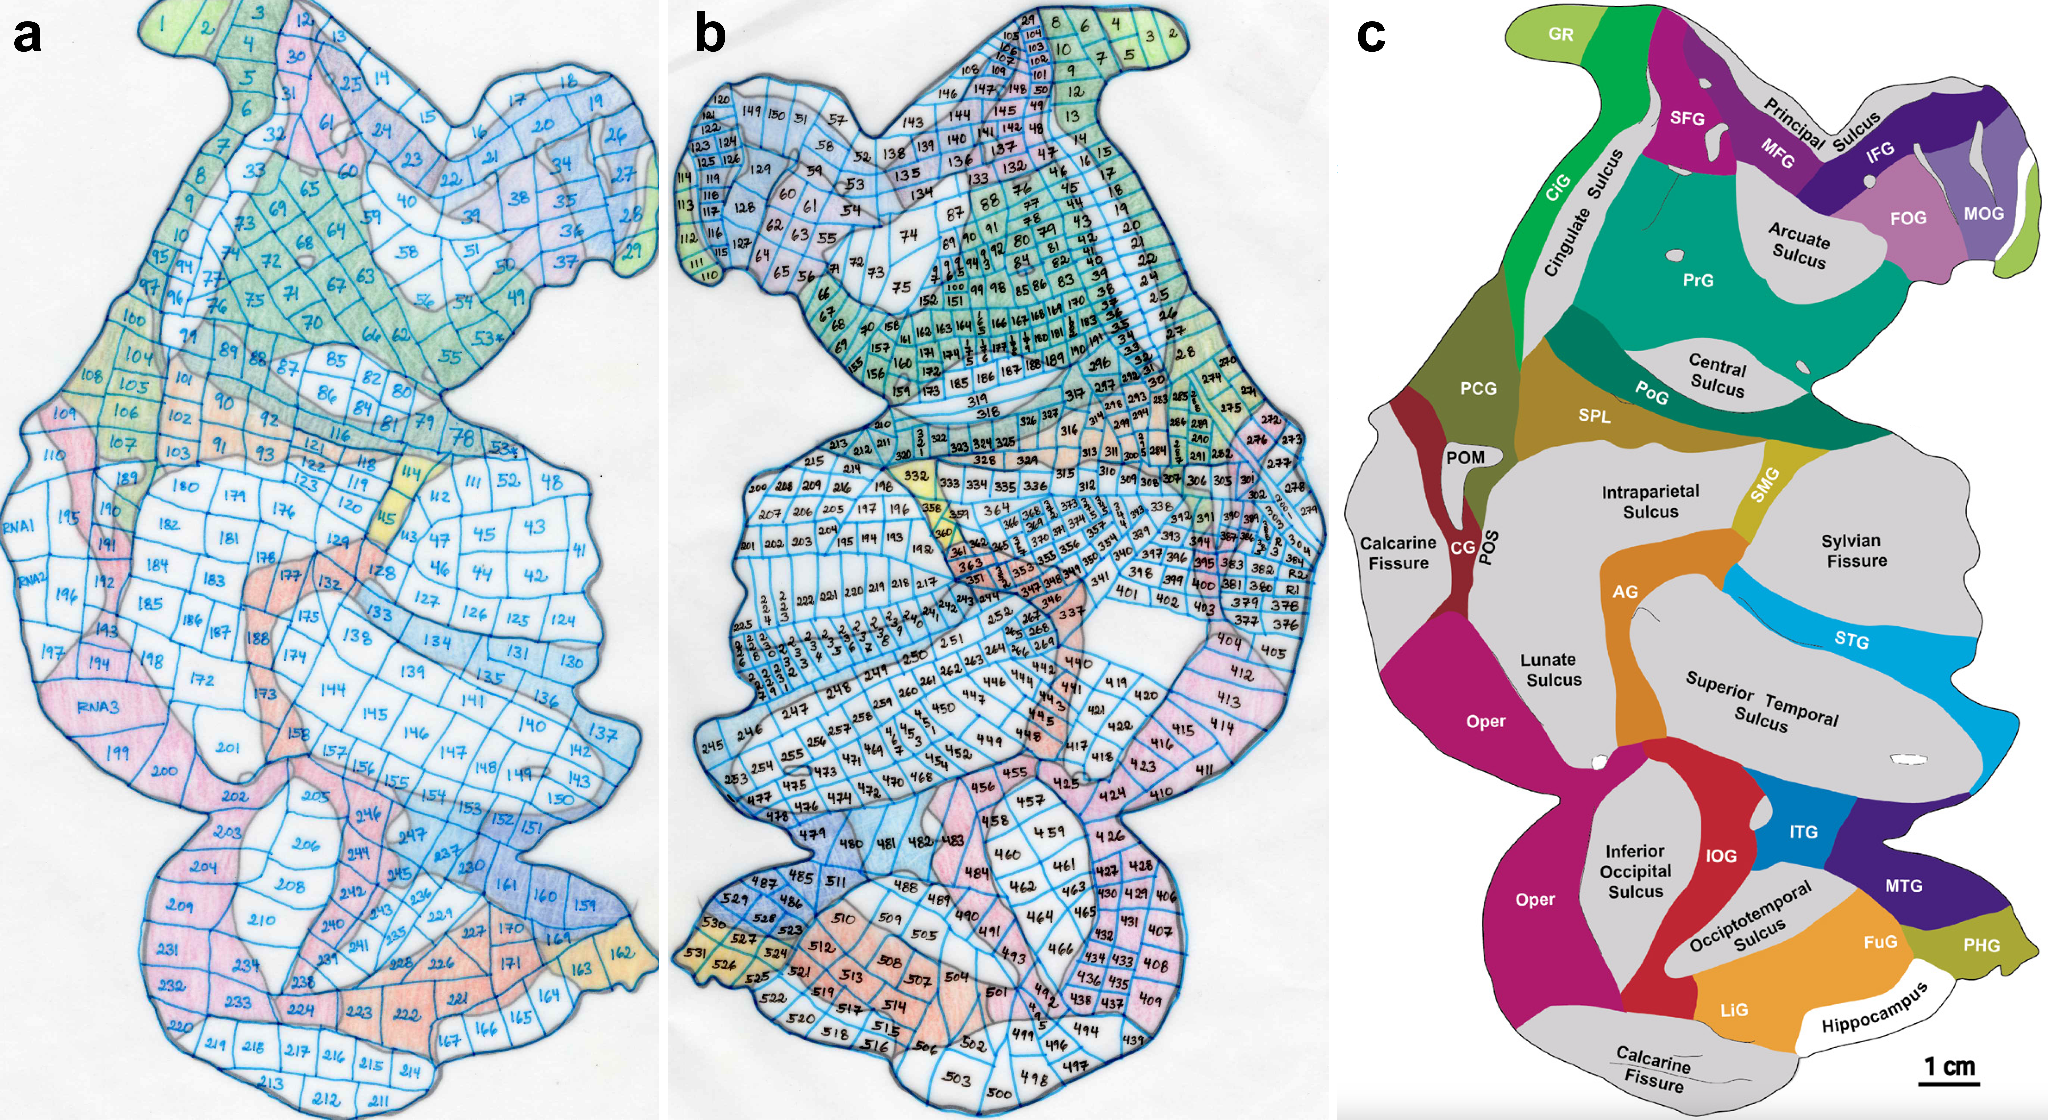
Tissue sample collection: Animals were sedated, prepared for surgery, and euthanized by propofol overdose prior to rapid transcardial perfusion with chilled PBS. The brain was bisected, and one hemisphere was separated from subcortical structures, cooled, and approximately flattened. The flattened cortex was voxelated by hand on dry ice into small tissue blocks (A26: ~4 mm/side; A27: ~2.5 mm/side). Voxels were immediately frozen and stored at -80°C.
Exsanguination control: A third animal (U5, juvenile male) had brain harvested without exsanguination, flash-frozen, and sampled by 3-mm punch biopsy.
Targeted metabolomics: Samples were profiled using the Quant 500 kit (Biocrates). A26: 406 samples; A27: 549 samples. Of 630 targeted metabolites, 328 (A26) and 343 (A27) were retained after quality filtering.
Untargeted proteomics: Data-independent acquisition (DIA) proteomics was performed. A26: 9,990 protein groups; A27: 10,253 protein groups after quality filtering.
PChclust: A principal component guided feature clustering algorithm that aggregates co-linear variables into representative clusters, with clusters represented by their first principal component.
Spatially regularized sparse CCA (sr-sCCA): Incorporates spatial neighborhood structure via graph Laplacian smoothing. Uses Delaunay triangulation to define spatial neighbors.
Pathway enrichment analysis: Used Metascape for pathway analysis with GO biological processes, Reactome, KEGG, and WikiPathways databases.
Results
The entire cortical sheet of one brain hemisphere was flattened and voxelated for two animals, yielding 237 (A26) and 511 (A27) unique mapped cortex locations. After quality control and matching, 233 (A26) and 508 (A27) samples had both metabolomic and proteomic data.
Targeted Metabolomics: Analytical Performance and Quality Control
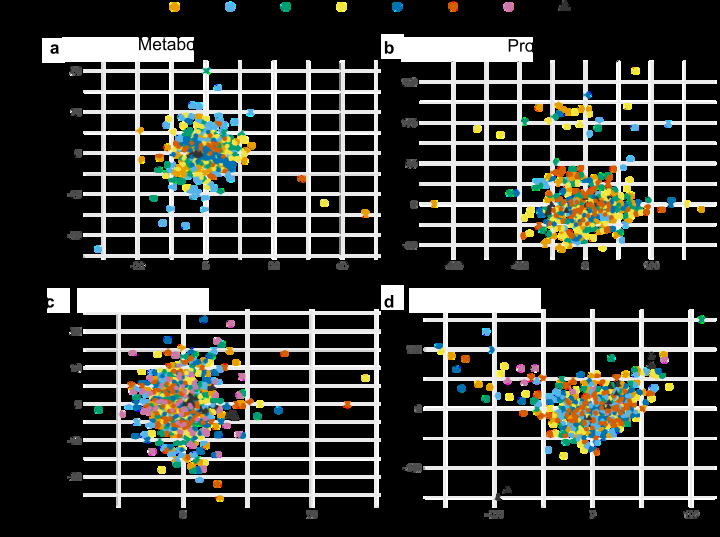
Of 630 targeted metabolites, 591 (A26) and 630 (A27) were detectable. After removing analytes with excessive missingness, 328 (A26) and 343 (A27) were retained. Within-plate technical reproducibility was high, with triglycerides and fatty acids showing higher variability (17–21%). PCA confirmed central clustering of study pool quality control (SPQC) replicates relative to study samples.
Untargeted Proteomics: Analytical Performance and Quality Control
Spectral library construction yielded 13,153 (A26) and 13,645 (A27) protein groups. After quality filtering, 9,990 (A26) and 10,253 (A27) protein groups were quantified. Per-sample identification rates averaged ~8,250 (A26) and ~8,600 (A27) protein groups per plate. Technical reproducibility was excellent: median CVs for SPQC were 6.2% (prep) and 6.4% (tech) for A26.
| A26 Metabolomics | A27 Metabolomics | A26 Proteomics | A27 Proteomics | |
|---|---|---|---|---|
| Samples submitted | 432 | 549 | 432 | 549 |
| Plates | 6 | 7 | 6 | 7 |
| Features detected | 591 metabolites | 630 metabolites | 13,153 protein groups | 13,645 protein groups |
| Features after QC | 328 metabolites | 343 metabolites | 9,990 protein groups | 10,253 protein groups |
| Matched cortex samples (final) | 233 | 508 | 233 | 508 |
Spatially Regularized Sparse Canonical Correlation (sr-sCCA) Analysis
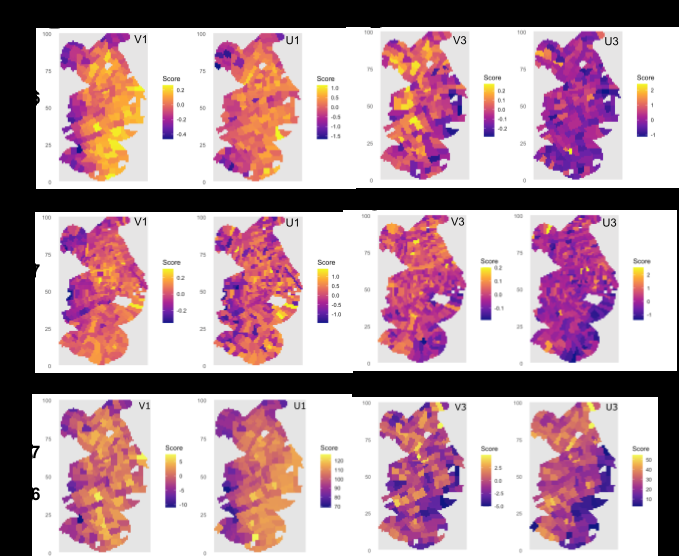
Because neighboring cortical voxels are not statistically independent, we developed sr-sCCA that incorporates spatial neighborhood structure via graph Laplacian smoothing. Figure 3 shows spatial distributions of the first (V1, U1) and third (V3, U3) canonical variate pairs for both animals. In both animals, metabolomic and proteomic canonical scores exhibit broadly similar spatial patterns: a mediolateral gradient for both first V and U components, and an anteromedial-posterolateral gradient for the third metabolomic component. Regions with higher metabolomic scores generally corresponded to regions with higher proteomic scores.
Spatial Decay of Molecular Similarity: Sampling Density Study
The two animals were voxelated at different resolutions (~4 mm for A26, ~2.5 mm for A27) to assess sampling density requirements. Across both metabolomic and proteomic data, average correlation decreases as neighbor order increases, indicating spatial decay of molecular similarity. A27’s denser sampling resolved regional heterogeneity in correlation structure in the metabolomic data that was not detectable in A26. This difference was less pronounced for proteomics.
Cross-Animal Reproducibility of Spatial Canonical Components
The A27-derived sr-sCCA canonical vectors were projected onto A26 data. For component 1, the projected maps showed a more coherent mediolateral gradient than evident in A27’s own sr-sCCA, particularly for proteomics. For component 3, A26’s own proteomic scores showed little spatial organization; the projection resolved this into a clear anteromedial-to-posterolateral gradient.
Effect of Exsanguination on Metabolomic Profiles
PCA of combined, QC3-normalized data showed clear separation of U5 (unperfused) from A26 and A27 along PC1, which accounted for 40.2% of total variance. A26 and A27 samples were intermixed despite originating from different animals and batches. Metabolites loading positively on PC1 (enriched in exsanguinated tissue) were dominated by brain-parenchymal membrane lipids: phosphatidylcholines, hexosylceramides, ceramides, and sphingomyelins. Metabolites loading negatively (enriched in blood-containing tissue) included triglycerides, diacylglycerols, spermine, and p-cresol sulfate.
Proteomic Clusters based on PChclust are Enriched with Proteins Associated with Signaling and Regulation
PChclust identified 5,041 clusters ranging from 1 to 638 proteins. Fifty-nine top-scoring clusters were used for pathway enrichment analysis. Three major pathways are highlighted:
Synaptic signaling, vesicle-mediated transport, neurotransmitters, cell-cell adhesion: This cluster contains 122 proteins. FDR significant pathways include regulation of synapse organization, modulation of chemical synaptic transmission, cell junction organization, and neuron projection development.
Mitochondria, aerobic respiration: This cluster contains 27 proteins. FDR significant pathways include mitochondrial protein degradation, mitochondrion organization, carboxylic acid metabolic process, and mitochondrial fission.
Splicing: Splicing proteins are highly represented in one cluster of 638 proteins. FDR significant pathways include spliceosome, chromatin remodeling, regulation of RNA splicing, and epigenetic regulation of gene expression.
Integrated Pathway Analysis Reconstructs Neuronal Metabolic Processes
Synaptic signaling, vesicle-mediated transport, neurotransmitters, cell-cell adhesion: Joint pathway analysis identified 211 pathways (33 FDR significant, p < 0.05). Pathways included alanine, aspartate and glutamate metabolism, cysteine and methionine metabolism, and ABC transporters. The synaptic vesicle cycle pathway identified 5 enriched metabolites and 2 proteins, covering both inhibitory (GABA, glycine) and excitatory (glutamic acid) signaling.
Mitochondria, aerobic respiration: Joint pathway analysis identified 201 pathways (35 FDR significant, p < 0.05). The valine, leucine, and isoleucine degradation pathway showed balance between proteins and metabolites. Glutathione metabolism was identified with 1 key protein (MGST3) and 7 metabolites.
Splicing: Joint pathway analysis identified 261 pathways (19 FDR significant, p < 0.05). The spliceosome was the foremost pathway.
Integrated pathway analysis of full proteomic and metabolomic results: Analysis identified 346 pathways (117 FDR significant, p < 0.05). Major pathways included endocytosis, axon guidance, glutamatergic synapse, sphingolipid signaling, and dopaminergic synapse. Neurodegenerative disease pathways had large numbers of mapped proteins including Alzheimer’s disease (271 proteins) and Parkinson’s disease (200).
| Protein cluster | Pathway | Analyte | Name |
|---|---|---|---|
| Cluster 3246: synaptic signaling, cell junction organization | Synaptic vesicle cycle | Protein | solute carrier family 6 member 7 (SLC6A7) |
| Protein | calcium voltage-gated channel subunit alpha1 B (CACNA1B) | ||
| Metabolite | gamma-Aminobutyric acid | ||
| Metabolite | Glutamic acid | ||
| Metabolite | Glycine | ||
| Metabolite | Serotonin | ||
| Metabolite | Histamine | ||
| Cluster 3986: mitochondria, aerobic respiration | Valine, leucine and isoleucine degradation | Protein | isovaleryl-CoA dehydrogenase (IVD) |
| Protein | methylmalonyl-CoA mutase (MMUT) | ||
| Protein | acyl-CoA dehydrogenase family member 8 (ACAD8) | ||
| Metabolite | Leucine | ||
| Metabolite | L-Valine | ||
| Metabolite | Isoleucine | ||
| Protein | microsomal glutathione S-transferase 3 (MGST3) | ||
| Glutathione metabolism | Metabolite | L-Cysteine | |
| Metabolite | Glutamic acid | ||
| Metabolite | Glycine | ||
| Metabolite | Ornithine | ||
| Metabolite | Putrescine | ||
| Metabolite | Spermidine | ||
| Metabolite | Spermine |
Discussion
We present a framework for generating spatially registered, paired metabolomic and proteomic maps across an entire cortical hemisphere in the rhesus monkey, together with analysis tools that explicitly incorporate spatial dependence. The core design decision was to have assays paired at the sample level rather than integrated by post hoc alignment. To handle dimensionality and collinearity, we developed PChclust. For cross-omic integration, we developed sr-sCCA, which incorporates spatial neighborhood structure.
Several lines of evidence indicate that our analysis captures real biology at the spatial scale of our measurements. Both sampling resolutions captured spatial decay of molecular similarity, but denser sampling in A27 resolved regional heterogeneity in the metabolome not detectable in A26. At both resolutions, sr-sCCA identified joint proteome–metabolome components that were spatially coherent, and cross-animal projection revealed conserved spatial structure. At the pathway level, unsupervised proteomic clustering recovered major neuronal processes — synaptic signaling, mitochondrial respiration, RNA splicing — and integrated pathway analysis reconstructed complete metabolic circuits within single voxels. Our recovery of neurotransmitter pathways from unsupervised spatial decomposition of bulk homogenized cortical tissue provides biological face validity.
Comparison with other spatial multi-omics approaches: Current spatial molecular methods offer micrometer-scale resolution but face fundamental spatial coverage problems for large brains. Our approach sacrifices resolution (millimeters rather than micrometers) and gains whole-hemisphere coverage and deep molecular profiling (~10,000 protein groups and ~330 metabolites per voxel). For questions about vulnerability and resilience in aging and Alzheimer’s disease, relevant spatial patterns span centimeters, making this trade-off reasonable.
Why non-human primates, and why exsanguination matters: Spatial patterns of pathology in AD have fine-grained features across association cortex for which rodent models offer limited homology. Dense spatial mapping would be difficult to obtain from humans directly; analyzing a whole human cortical hemisphere represents significant opportunity cost. Furthermore, preservation and isolation of biomolecules in human samples is challenging. The exsanguination-associated variance dominated metabolomic data structure (PC1 ~40%), driven by blood-borne lipids rather than brain-parenchymal species. The PC1 axis did not correlate with sr-sCCA components, indicating spatial patterns in A26 and A27 are not primarily explained by blood-related effects.
Limitations: The most obvious limitation is sample size. While primarily a methods-development report, with metabolome and proteome from the same homogenate and maps defined across each animal’s cortex, the hundreds of voxels per animal are the biological replicates. Cross-animal projection provides evidence of conserved spatial patterns. The targeted metabolomics panel constrains coverage to ~330 metabolites after quality filtering. Voxel sizes (~2.5–4 mm) do not support laminar or columnar resolution. The tissue handling timeline (~2.5 hours from anoxia to last frozen voxel) introduces possibility of metabolite degradation; dissection order was counterbalanced and no opposing spatial gradients were observed.
What our method enables: We do not yet know at what spatial scales molecular vulnerability and resilience patterns are organized in the aging primate cortex. The framework we developed makes it feasible to ask these questions across a series of animals spanning the aging trajectory, with paired molecular and histopathological atlases. The methods are our contributions; insights will come from applying them.
References
Harman, D. Alzheimer’s disease pathogenesis: role of aging: Role of aging. Ann. N. Y. Acad. Sci. 1067, 454–460 (2006).
Caselli, R. J., Chen, K., Lee, W., Alexander, G. E. & Reiman, E. M. Correlating cerebral hypometabolism with future memory decline in subsequent converters to amnestic pre-mild cognitive impairment. Arch. Neurol. 65, 1231–1236 (2008).
Jack, C. R., Jr & Holtzman, D. M. Biomarker modeling of Alzheimer’s disease. Neuron 80, 1347–1358 (2013).
Mosconi, L. et al. Hippocampal hypometabolism predicts cognitive decline from normal aging. Neurobiol. Aging 29, 676–692 (2008).
Jansen, W. J. et al. Prevalence of cerebral amyloid pathology in persons without dementia: a meta-analysis: A meta-analysis. JAMA 313, 1924–1938 (2015).
Pletnikova, O. et al. The spectrum of preclinical Alzheimer’s disease pathology and its modulation by ApoE genotype. Neurobiol. Aging 71, 72–80 (2018).
Johnson, E. C. B. et al. Large-scale proteomic analysis of Alzheimer’s disease brain and cerebrospinal fluid reveals early changes in energy metabolism associated with microglia and astrocyte activation. Nat. Med. 26, 769–780 (2020).
SantaCruz, K. S. et al. Alzheimer disease pathology in subjects without dementia in 2 studies of aging: the Nun Study and the Adult Changes in Thought Study. J. Neuropathol. Exp. Neurol. 70, 832–840 (2011).
Braak, H. & Braak, E. Neuropathological stageing of Alzheimer-related changes. Acta Neuropathol. 82, 239–259 (1991).
Braak, H. & Braak, E. Frequency of stages of Alzheimer-related lesions in different age categories. Neurobiol. Aging 18, 351–357 (1997).
Jack, C. R., Jr et al. Tracking pathophysiological processes in Alzheimer’s disease: an updated hypothetical model of dynamic biomarkers. Lancet Neurol. 12, 207–216 (2013).
Dickerson, B. C. et al. The cortical signature of Alzheimer’s disease: regionally specific cortical thinning relates to symptom severity in very mild to mild AD dementia and is detectable in asymptomatic amyloid-positive individuals. Cereb. Cortex 19, 497–510 (2009).
Seeley, W. W., Crawford, R. K., Zhou, J., Miller, B. L. & Greicius, M. D. Neurodegenerative diseases target large-scale human brain networks. Neuron 62, 42–52 (2009).
Scholefield, M. et al. Effects of alterations of post-mortem delay and other tissue-collection variables on metabolite levels in human and rat brain. Metabolites 10, 438 (2020).
Gonzalez-Riano, C. et al. Metabolomics and neuroanatomical evaluation of post-mortem changes in the hippocampus. Brain Struct. Funct. 222, 2831–2853 (2017).
Pinu, F. R. et al. Systems biology and multi-omics integration: Viewpoints from the metabolomics research community. Metabolites 9, 76 (2019).
O’Connor, L. M., O’Connor, B. A., Lim, S. B., Zeng, J. & Lo, C. H. Integrative multi-omics and systems bioinformatics in translational neuroscience: A data mining perspective. J. Pharm. Anal. 13, 836–850 (2023).
Vogel, C. & Marcotte, E. M. Insights into the regulation of protein abundance from proteomic and transcriptomic analyses. Nat. Rev. Genet. 13, 227–232 (2012).
Sincich, L. C., Adams, D. L. & Horton, J. C. Complete flatmounting of the macaque cerebral cortex. Vis. Neurosci. 20, 663–686 (2003).
Srinath, R. et al. Early emergence of solid shape coding in natural and deep network vision. Curr. Biol. 31, 51–65.e5 (2021).
Leek, J. T., Johnson, W. E., Parker, H. S., Jaffe, A. E. & Storey, J. D. The sva package for removing batch effects and other unwanted variation in high-throughput experiments. Bioinformatics 28, 882–883 (2012).
Zhou, Y. et al. Metascape provides a biologist-oriented resource for the analysis of systems-level datasets. Nat. Commun. 10, 1523 (2019).
Malliou, G. et al. CSF metabolomic signatures across five proteomic subtypes in patients with Alzheimer’s disease. Alzheimers. Dement. 21 Suppl 1, e101527 (2025).
Feng, W. et al. NULISA: a proteomic liquid biopsy platform with attomolar sensitivity and high multiplexing. Nat. Commun. 14, 7238 (2023).
Zararsiz, G. E. et al. Interlaboratory comparison of standardised metabolomics and lipidomics analyses in human and rodent blood using the MxP® Quant 500 kit. bioRxiv (2024). doi:10.1101/2024.11.13.619447
Wang, H. et al. An integrated proteomics and metabolomics analysis of methylglyoxal-induced neurotoxicity in a human neuroblastoma cell line. Npj Sci. Food 8, 84 (2024).
Kim, S. G. et al. Integrative metabolome and proteome analysis of cerebrospinal fluid in Parkinson’s disease. Int. J. Mol. Sci. 25, 11406 (2024).
Bordanaba-Florit, G. et al. Integration of proteomic and metabolomic analysis reveal distinct metabolic alterations of prostate cancer-associated fibroblasts compared to normal fibroblasts from patient’s stroma samples. Biochim. Biophys. Acta Mol. Basis Dis. 1870, 167229 (2024).
Chen, M. et al. Investigation into potential mechanisms of metabolic syndrome by integrative analysis of metabolomics and proteomics. PLoS One 17, e0270593 (2022).
Sanches, P. H. G., de Melo, N. C., Porcari, A. M. & de Carvalho, L. M. Integrating molecular perspectives: Strategies for comprehensive multi-omics integrative data analysis and machine learning applications in transcriptomics, proteomics, and metabolomics. Biology (Basel) 13, 848 (2024).
Acharya, D. & Mukhopadhyay, A. A comprehensive review of machine learning techniques for multi-omics data integration: challenges and applications in precision oncology. Brief. Funct. Genomics 23, 549–560 (2024).
Morabito, A., De Simone, G., Pastorelli, R., Brunelli, L. & Ferrario, M. Algorithms and tools for data-driven omics integration to achieve multilayer biological insights: a narrative review. J. Transl. Med. 23, 425 (2025).